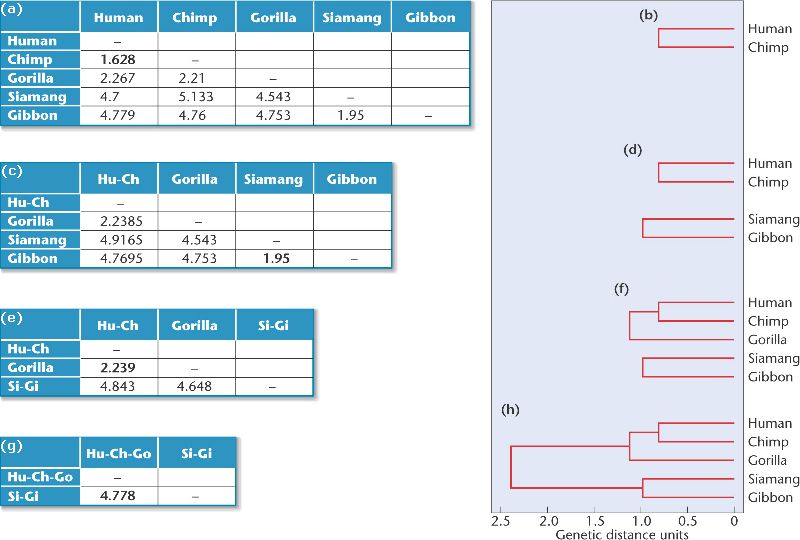
[Page 654] The starting point for UPGMA is a table of genetic distances among a group of species [Figure 26-19(a)]. To demonstrate the technique, we will use data from DNA hybridization studies by Charles Sibley and Jon Alquist, who computed genetic distances between humans and four species of apes: the common chimpanzee, the gorilla, the siamang, and the common gibbon.
Figure 26-19. Phylogeny reconstruction by UPGMA. (This item is displayed on page 655 in the print version) [View full size image]
The method uses the following steps:
1. Search for the smallest genetic distance between any pair of species. In Figure 26-19(a), this distance is 1.628, the distance between human and chimpanzee. Once identified, the corresponding species pair is placed on neighboring branches of an evolutionary tree [Figure 26-19(b)]. The length of each branch is half the genetic distance between the species (1.628/2), so the branches connecting human and chimpanzee to their common ancestor are each about 0.81.
2. Recalculate the genetic distances between this species pair and all other species [Figure 26-19(c)]. The genetic distance between the human-chimpanzee (Hu-Ch) cluster[*] and the other species is the average of the distances between each member of the cluster and the other species. For example, the genetic distance between the human-chimp cluster and the gorilla is the average of the human-gorilla distance and the chimp-gorilla distance, or
[*] We say "cluster" even though what we really have is a pair; the reason is that we can (and will) form larger groups and it is convenient to call them by the same, more inclusive name - ergo cluster.
3. Repeat steps 1 and 2 until all the species have been added to the tree.
The smallest distance in the recalculated table is 1.95, the distance between siamang and gibbon [Figure 26-19(c)]. To build the next section of the tree, siamang and gibbon are placed on neighboring branches, with lengths equal to half of 1.95, or 0.98. [Figure 26-19(d)].
Recalculating the table, we now find that there are two clusters plus the gorilla [Figure 26-19(e)]. The genetic distance between the human-chimp cluster and the siamang-gibbon cluster is the average of four distances: human-siamang, human-gibbon, chimp-siamang, and chimp-gibbon.
Now the smallest genetic distance is 2.239, the distance between the human-chimp cluster and the gorilla. We therefore add a gorilla branch to the tree and connect it to the common ancestor of the human-chimp cluster [Figure 26-19(f)]. The branches are drawn so that the distance between the tips of any two branches in the human-chimp-gorilla cluster is 2.239.
Recalculating the table for the final time [Figure 26-19(g)], we find that the genetic distance between the human-chimp-gorilla cluster and the siamang-gibbon cluster is the average of six genetic distances: human-siamang, human-gibbon, chimp-siamang, chimp-gibbon, gorilla- siamang, and gorilla-gibbon. This distance is 4.778, which allows us to complete our evolutionary tree [Figure 26-19(h)]. The tree indicates that humans and chimpanzees are one another's closest relatives. That is not to say that humans evolved from chimpanzees; rather, humans and chimpanzees share a more recent common ancestor than either shares with other species on the tree.